
3D renderings for mixed-use projects: phasing visualization
Show investors and tenants exactly how your mixed-use project unfolds. Photoreal 3D renderings turn phasing timelines into visual certainty.
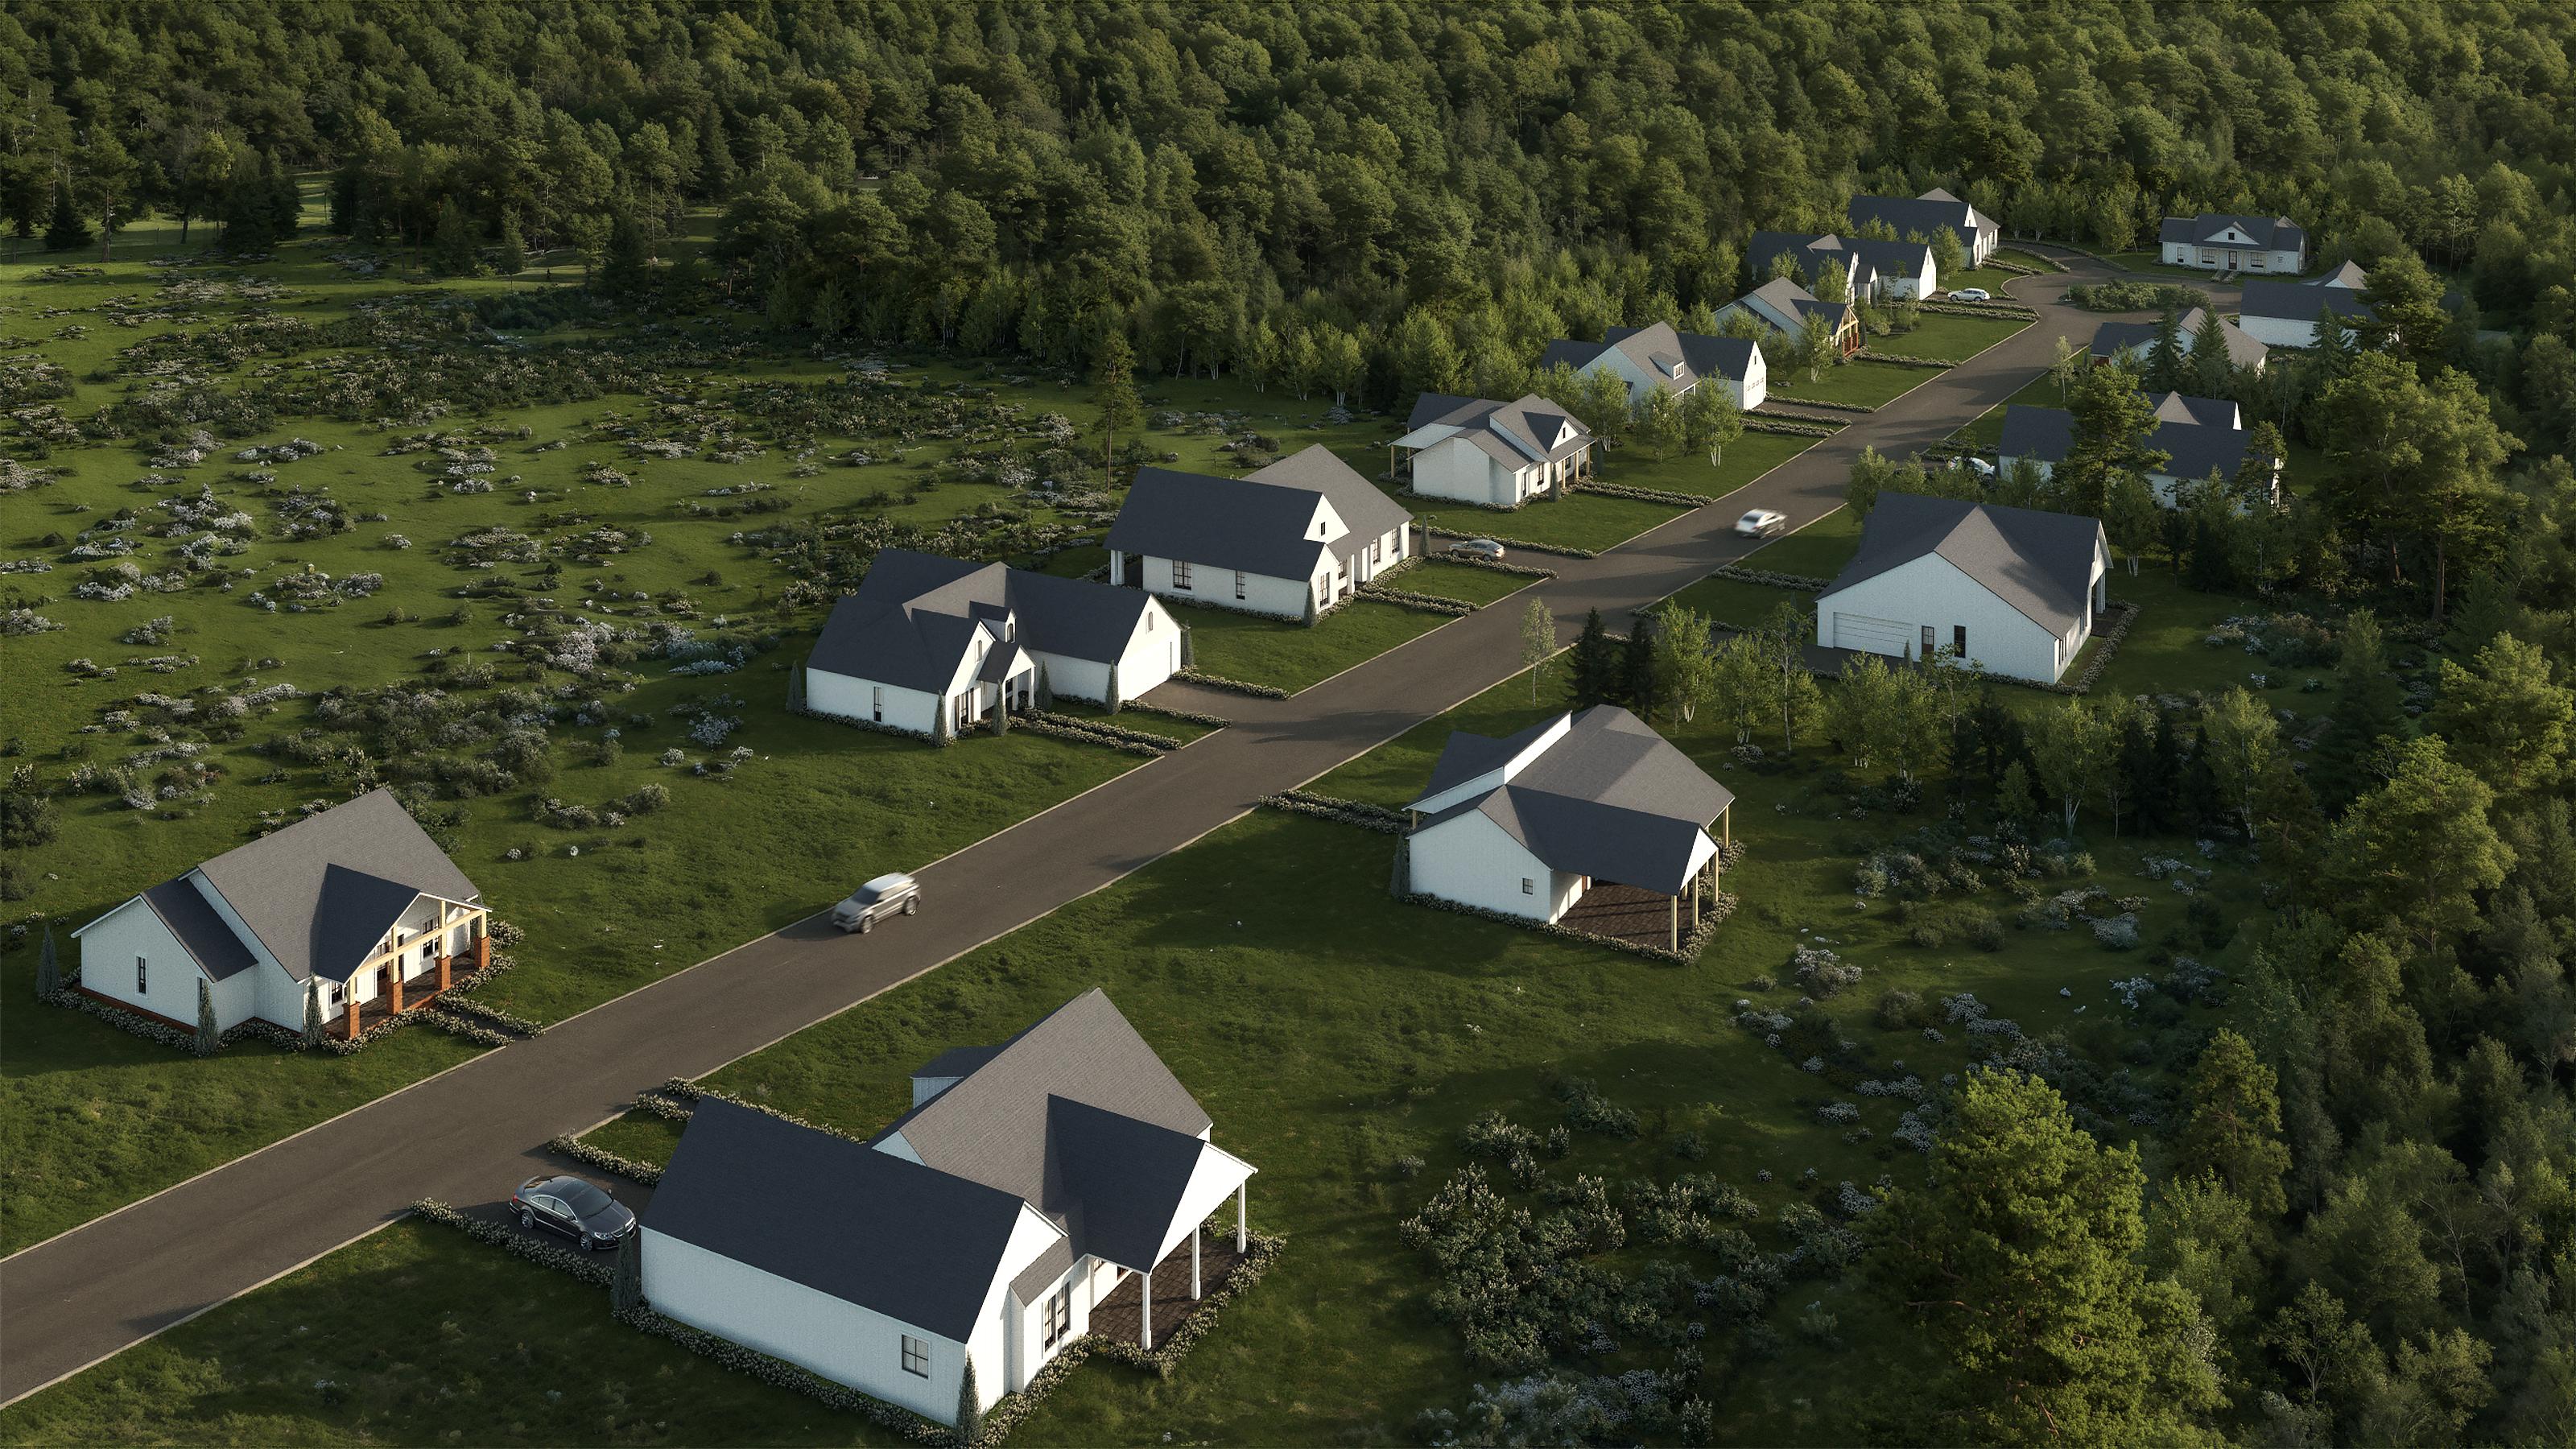
Mixed-use projects move in phases. Phase 1 is retail and parking. Phase 2 adds residential. Phase 3 caps it with office. Investors, lenders, and future tenants need to see how those pieces fit together and when they'll actually exist.
Static floor plans and spreadsheets don't do that. Photoreal 3D renderings do.
Why phasing gets its own visualization layer
Mixed-use development is complex by design. You're coordinating retail leasing timelines against residential pre-sales against commercial build-outs. Phasing risk is real: if Phase 1 underperforms, Phase 2 budgets compress. If parking is insufficient during Phase 1, early retail tenants leave.
Your lender sees this risk. So does your anchor tenant. They need to understand not just the final product, but the intermediate states and how foot traffic, parking, and tenant mix evolve across 24, 36, or 48 months.
A rendering that shows only the finished project sidesteps the question entirely.
Rendering each phase as a distinct product
The technical approach is straightforward: build separate photoreal renderings for Phase 1 completion, Phase 1+2 completion, and final buildout. Each is a full 360-degree view of the site from multiple angles and times of day.
This is not a slideshow or animation overlay. Each phase is a complete, credible image. A lender or future tenant can study Phase 1 parking density, sight lines to retail frontage, and landscaping maturity as if that configuration were the only one that existed.
Then they see Phase 2 added, and the questions shift: Does the new residential tower block sun from the Phase 1 plaza? Is there a coherent pedestrian flow between retail and new units? Does parking remain rational?
Layering in construction documentation
Phasing renderings are most powerful when paired with a construction timeline. Show the rendering for Phase 1. Below it, state the occupancy date. Add a sentence on what gets locked in (retail tenant commitments, unit pre-sales %). Then Phase 2 rendering, occupancy, commitments.
This combination removes ambiguity. It is not a promise. It is a scenario with named assumptions.
If Phase 1 retail revenue impacts Phase 2 residential pricing, that delta becomes visible in the rendering strategy. Lenders and tenant prospects see the dependency and can model their own risk accordingly.
Investor and tenant confidence
Mixed-use projects live or die on confidence. An investor who cannot visualize Phase 2 moving forward if Phase 1 underperforms has to assume the worst. A residential prospect who cannot see the final plaza, the retail mix, or the relationship to parking has to imagine it, and imagination is expensive in real estate.
Photoreal renderings for each phase give all parties the same image to work from. Discussion shifts from "What will it look like?" to "Is this plan executable?" That is a conversation a development team can win.
Practical workflow
Phasing renderings are not a add-on cost per phase. They are built into the master 3D model once. After that, the render artist generates views for each intermediate state. Turnaround is typically 2-3 weeks for a 3-5 phase project, depending on model complexity and revision scope.
The return is immediate: a clearer pitch deck, faster lender approval, higher retail and residential pre-lease velocity.
Phasing visualization is not a cosmetic upgrade to your development story. It is a risk-management tool that your capital partners and tenants already expect. Building it into your project timeline from day one saves rework and accelerates confidence.